Visual Studio Code
Microsoft Visual Studio Code (VS Code) is a popular cross-platform, general-purpose, open source IDE. Thanks to its powerful extensions ecosystem it supports many languages as well as deep customization options for themes, fonts, keyboard controls, and more.
This tutorial teaches you how to integrate VS Code with kde-builder.
Installation
Debian, Ubuntu, Kubuntu, KDE neon
sudo apt-get install wget gpg
wget -qO- https://packages.microsoft.com/keys/microsoft.asc | gpg --dearmor > packages.microsoft.gpg
sudo install -D -o root -g root -m 644 packages.microsoft.gpg /etc/apt/keyrings/packages.microsoft.gpg
echo "deb [arch=amd64,arm64,armhf signed-by=/etc/apt/keyrings/packages.microsoft.gpg] https://packages.microsoft.com/repos/code stable main" | sudo tee /etc/apt/sources.list.d/vscode.list > /dev/null
rm -f packages.microsoft.gpg
sudo apt install apt-transport-https
sudo apt update
sudo apt install code
openSUSE
sudo rpm --import https://packages.microsoft.com/keys/microsoft.asc
echo -e "[code]\nname=Visual Studio Code\nbaseurl=https://packages.microsoft.com/yumrepos/vscode\nenabled=1\ntype=rpm-md\ngpgcheck=1\ngpgkey=https://packages.microsoft.com/keys/microsoft.asc" | sudo tee /etc/zypp/repos.d/vscode.repo > /dev/null
sudo zypper refresh
sudo zypper install code
Fedora
sudo rpm --import https://packages.microsoft.com/keys/microsoft.asc
echo -e "[code]\nname=Visual Studio Code\nbaseurl=https://packages.microsoft.com/yumrepos/vscode\nenabled=1\ngpgcheck=1\ngpgkey=https://packages.microsoft.com/keys/microsoft.asc" | sudo tee /etc/yum.repos.d/vscode.repo > /dev/null
dnf check-update
sudo dnf install code
Arch, Manjaro
sudo pacman -S vscodeAlso, you may prefer to install VS Codium instead (a variant of VS Code without Microsoft telemetry). See documentation for more information.
Setup
The KDE build tool kde-builder can automatically generate the configuration files needed for VS Code to work with KDE projects.
To enable this feature, first ensure that kde-builder is installed and
configured; then enable the feature in the kde-builder configuration file
(located at ~/.config/kde-builder.yaml by default) - ensure these options are in
the global section and set to true:
compile-commands-linking: true
compile-commands-export: true
generate-vscode-project-config: true
With these settings, projects built by kde-builder will have the hidden
.vscode folder created in their source directory; for example, for KCalc this
would be kde/src/kcalc/.vscode.
The configuration files are generated when a project is built or rebuilt with
kde-builder. If you have already built the project you want to work on
before enabling the generate-vscode-project-config option, make sure to
rebuild it before opening it in VS Code.
Working on a project
We will use KCalc as an example.
Tip
The Command Palette (Ctrl+Shift+P) is your friend. It allows you to search for and run commands
and it is a great way to discover features.Opening the project
The project can be opened as a workspace in vs code by opening the src directory as a folder:
File->Open Folder...- Select the project's source code directory:
~/kde/src/kcalc
If you have the kde-builder configuration set up as described above, VS Code
will automatically detect the .vscode folder and load the project with the
correct settings.
The following configuration sections will only need to be done the first time you open a new project in VS Code.
Installing extensions
A notification popup at the bottom-right of the window will ask if you want to install the recommended extensions for working on this project:
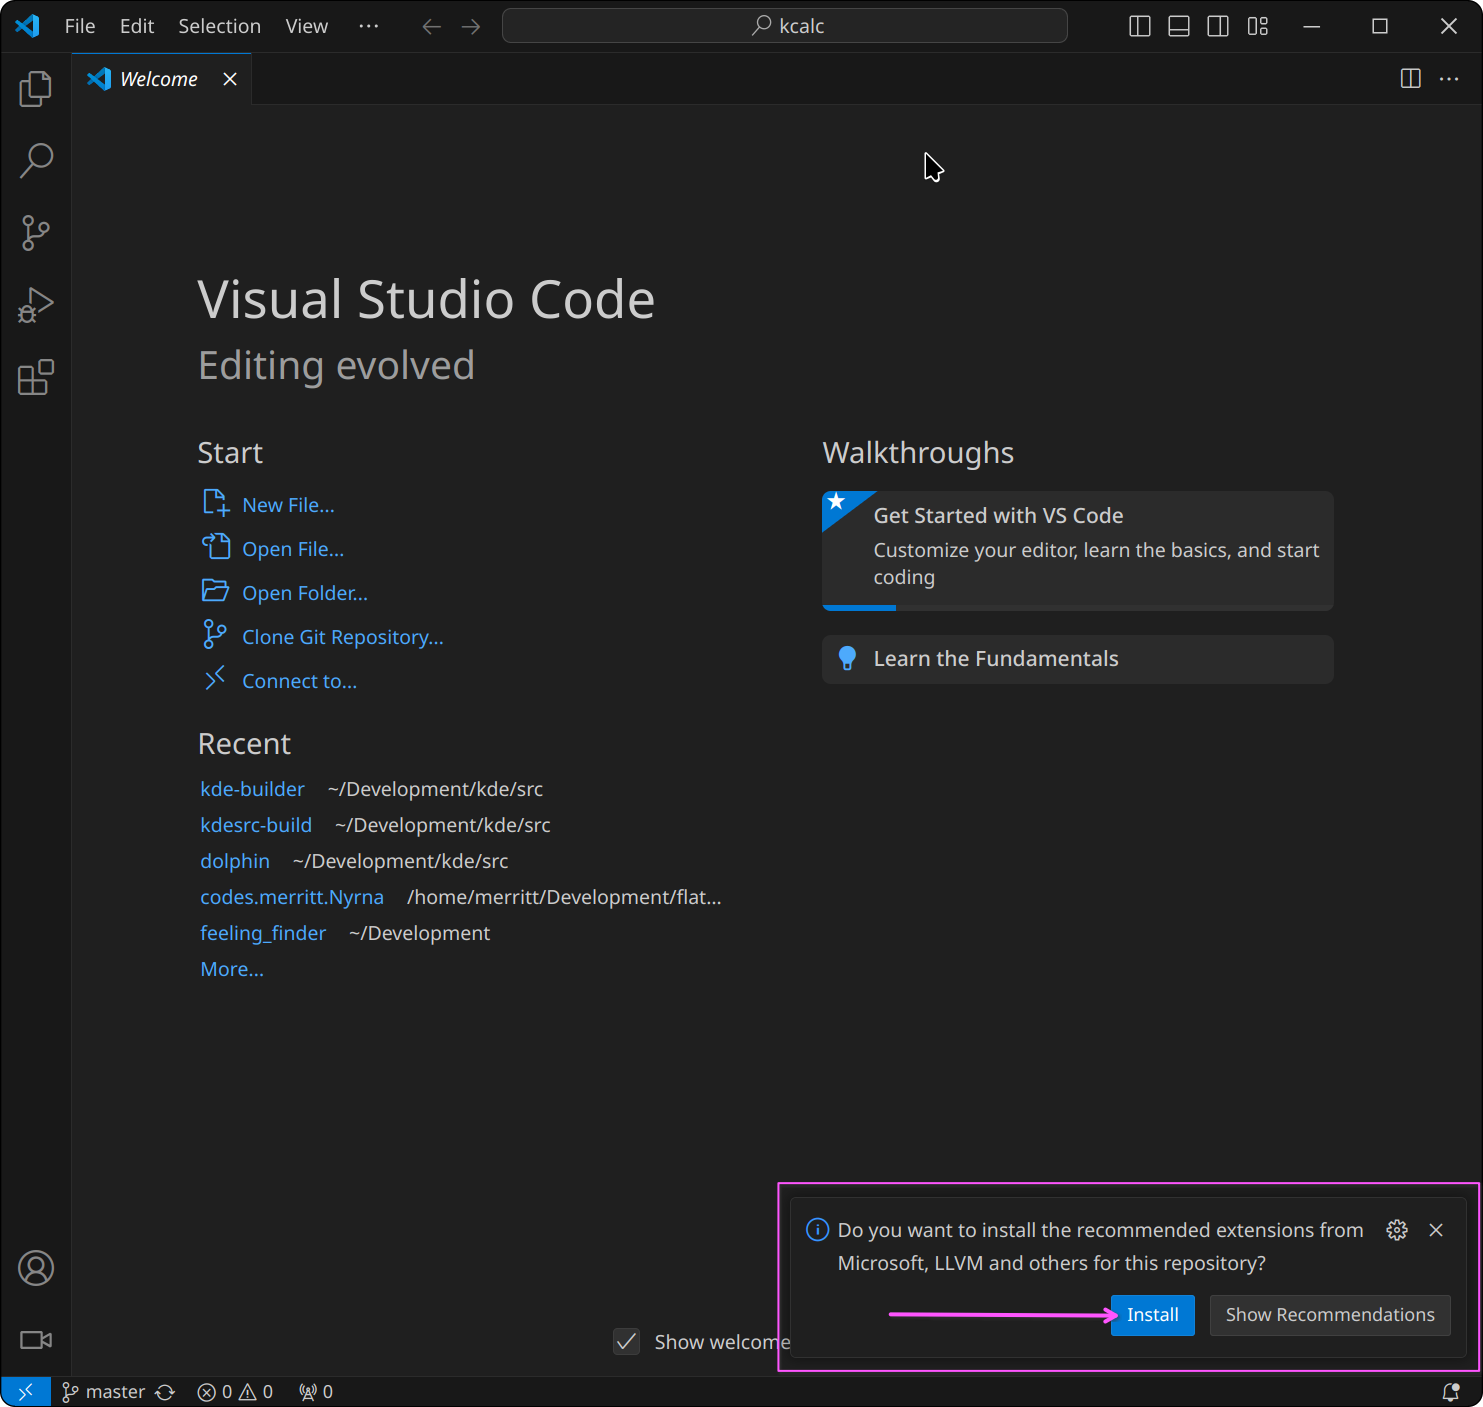
These extensions add support to VS Code for technologies commonly used in KDE projects, such as CMake, C++, Qt, and more.
Click Install.
Configuring the project
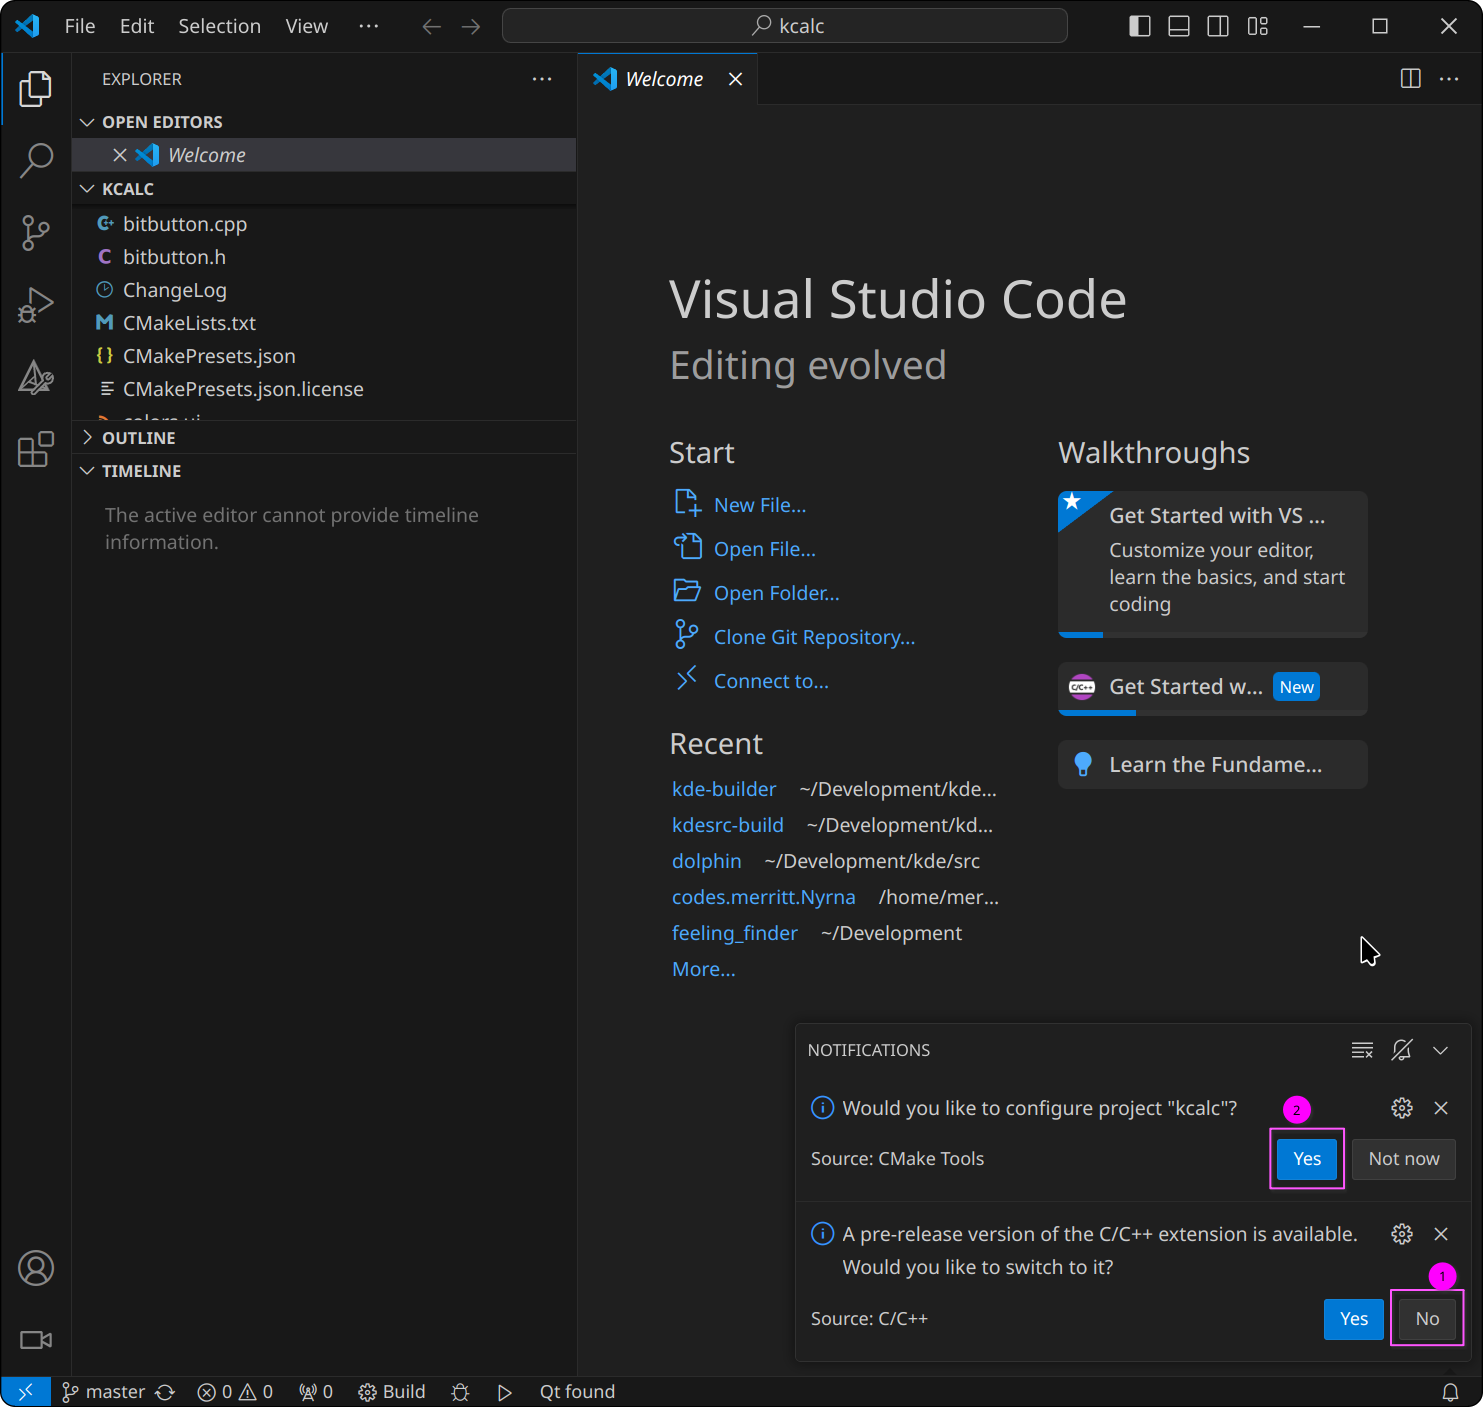
After the extensions have been installed:
- If a notification prompt asks if you want to switch to a pre-release version
of the C++ extension, click
No. - A notification prompt will ask
Would you like to configure project "kcalc"?ClickYes.
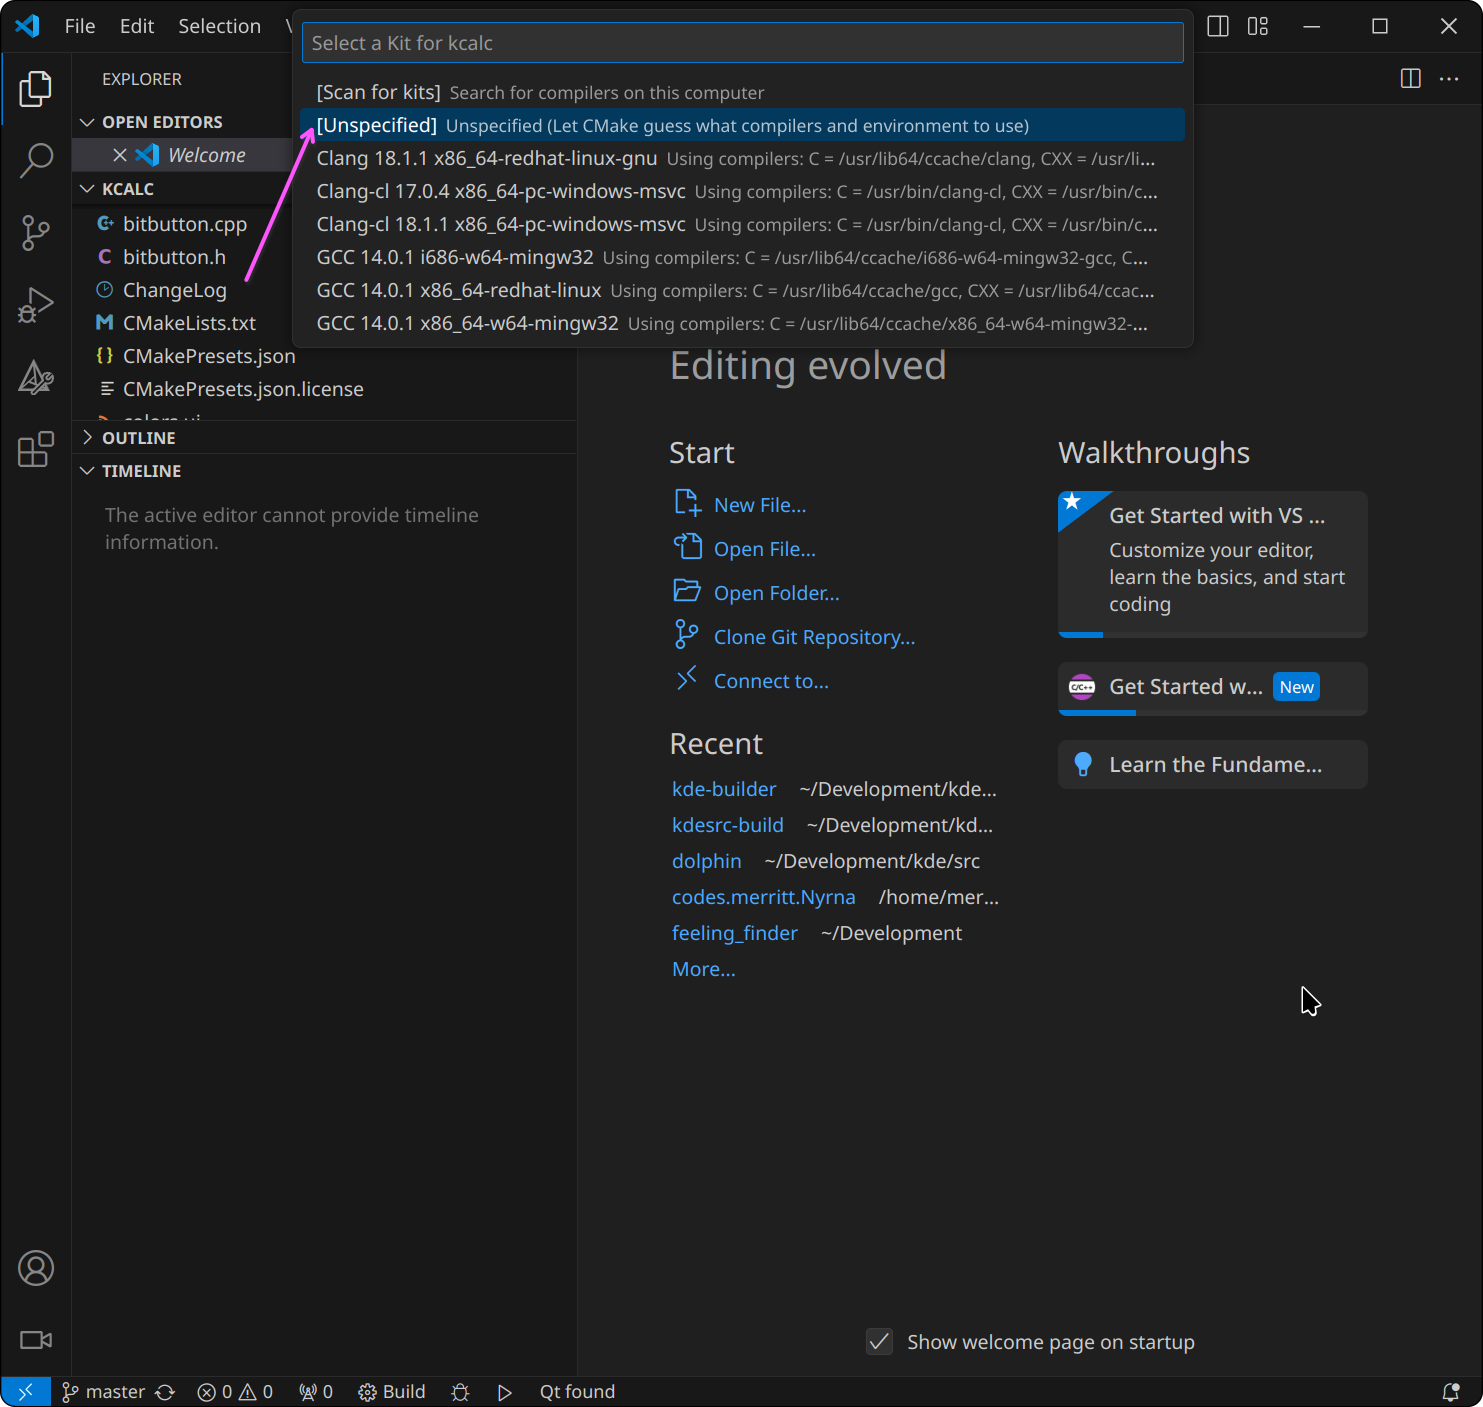
A prompt will open at the top-middle of the window asking to choose a kit
(a set of predefined configurations used when building and running the project). Select
Unspecified to have the kit chosen automatically based on the project and
system configuration:
The integrated terminal will open at the bottom of the window, and if the project was configured successfully, the last line should say:
[cmake] -- Build files have been written to: /home/<username>/kde/build/kcalc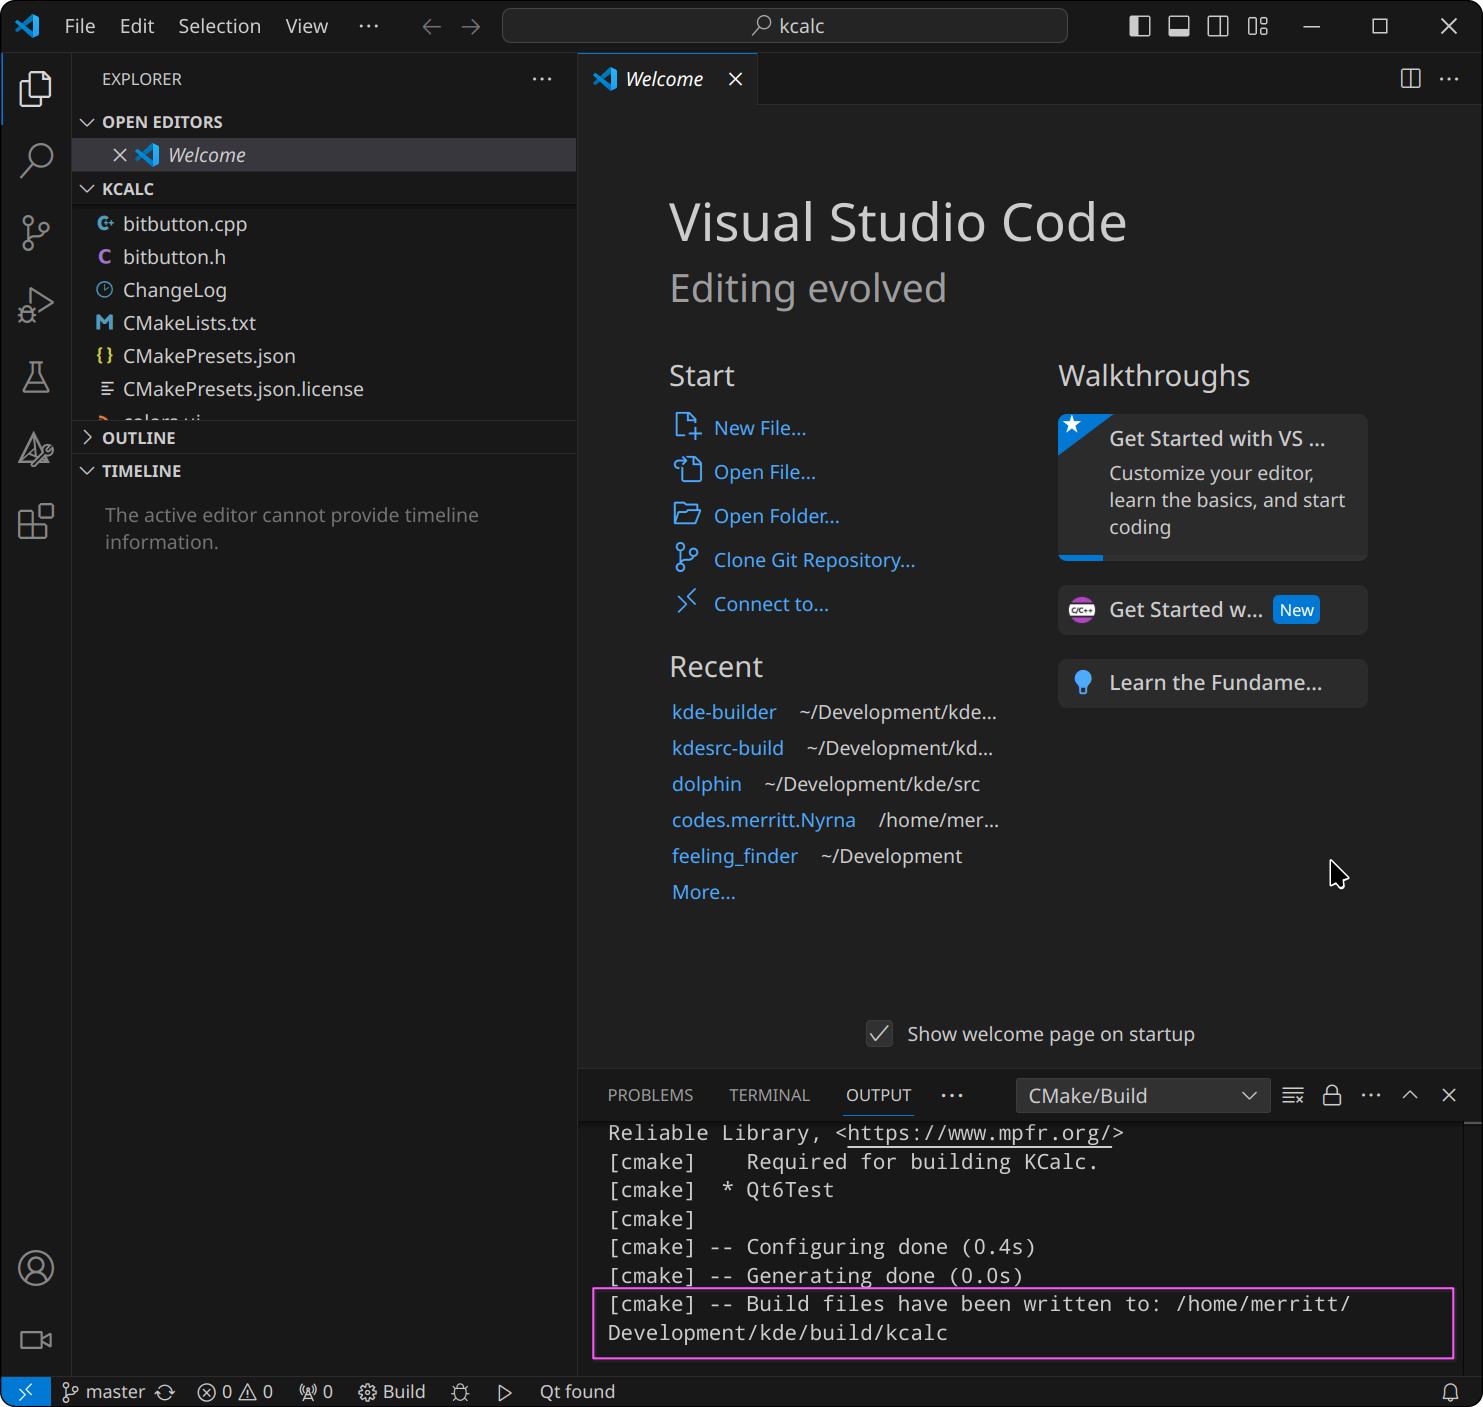
You are ready to start working on the code with VS Code! 🎉
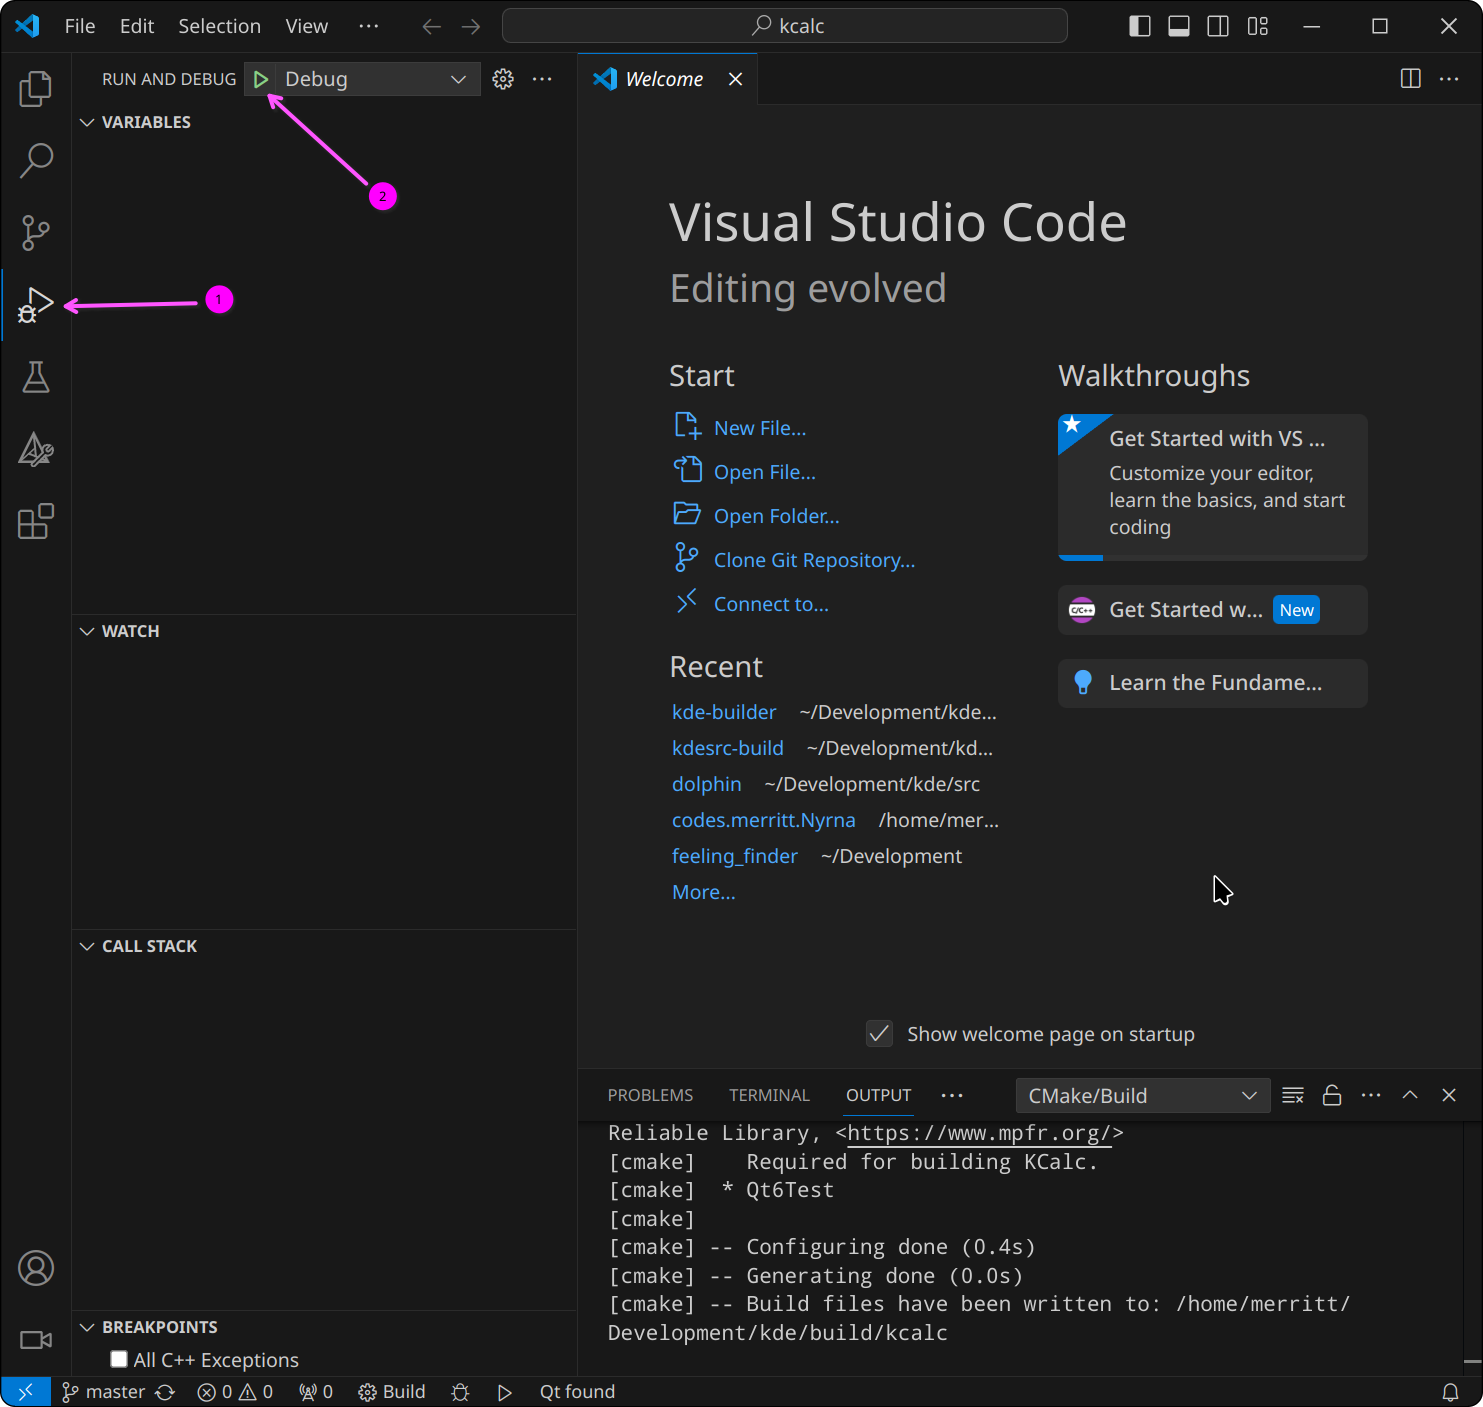
Debugging
To start debugging, click on the Run and Debug icon on the left sidebar, then
click on the green play button to start debugging.
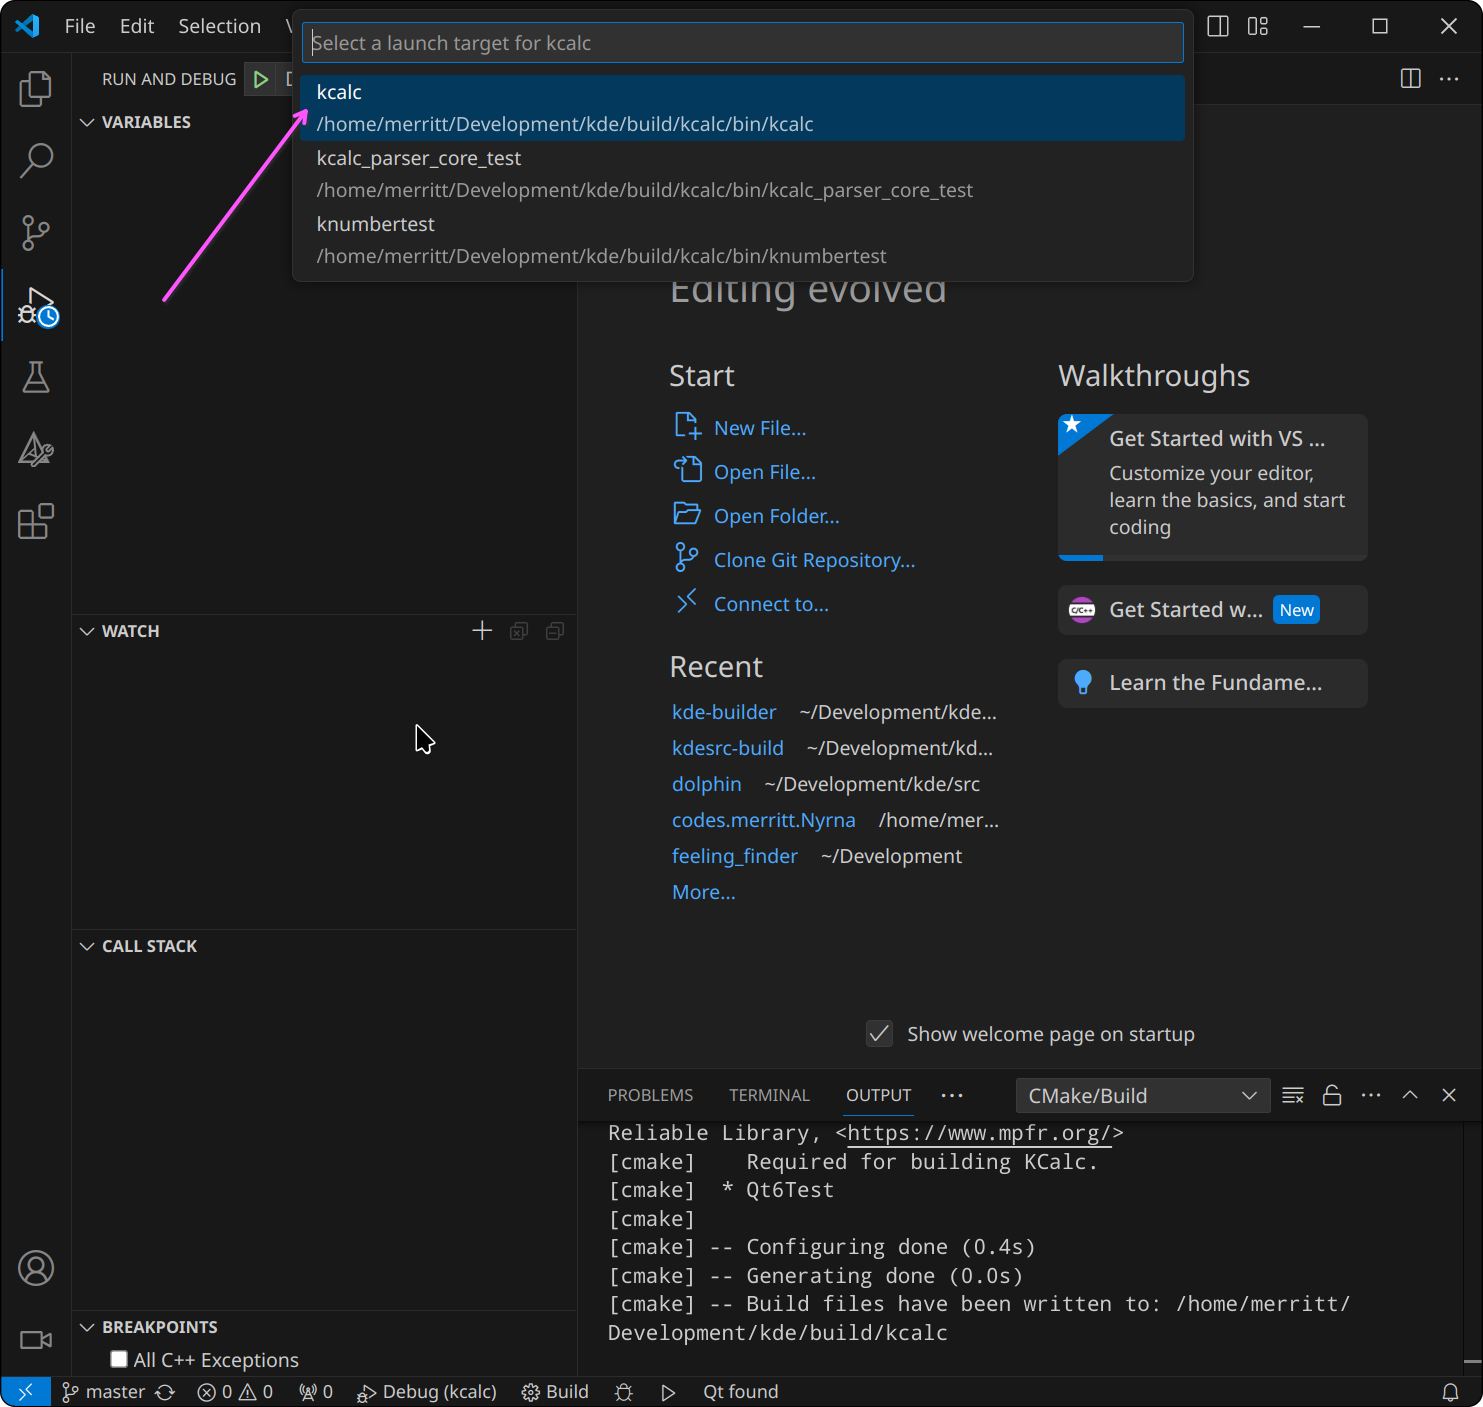
If the project has multiple targets it will open a prompt at the top-middle of
the window asking to choose a target. Select the target you want to debug; in
this case, kcalc:
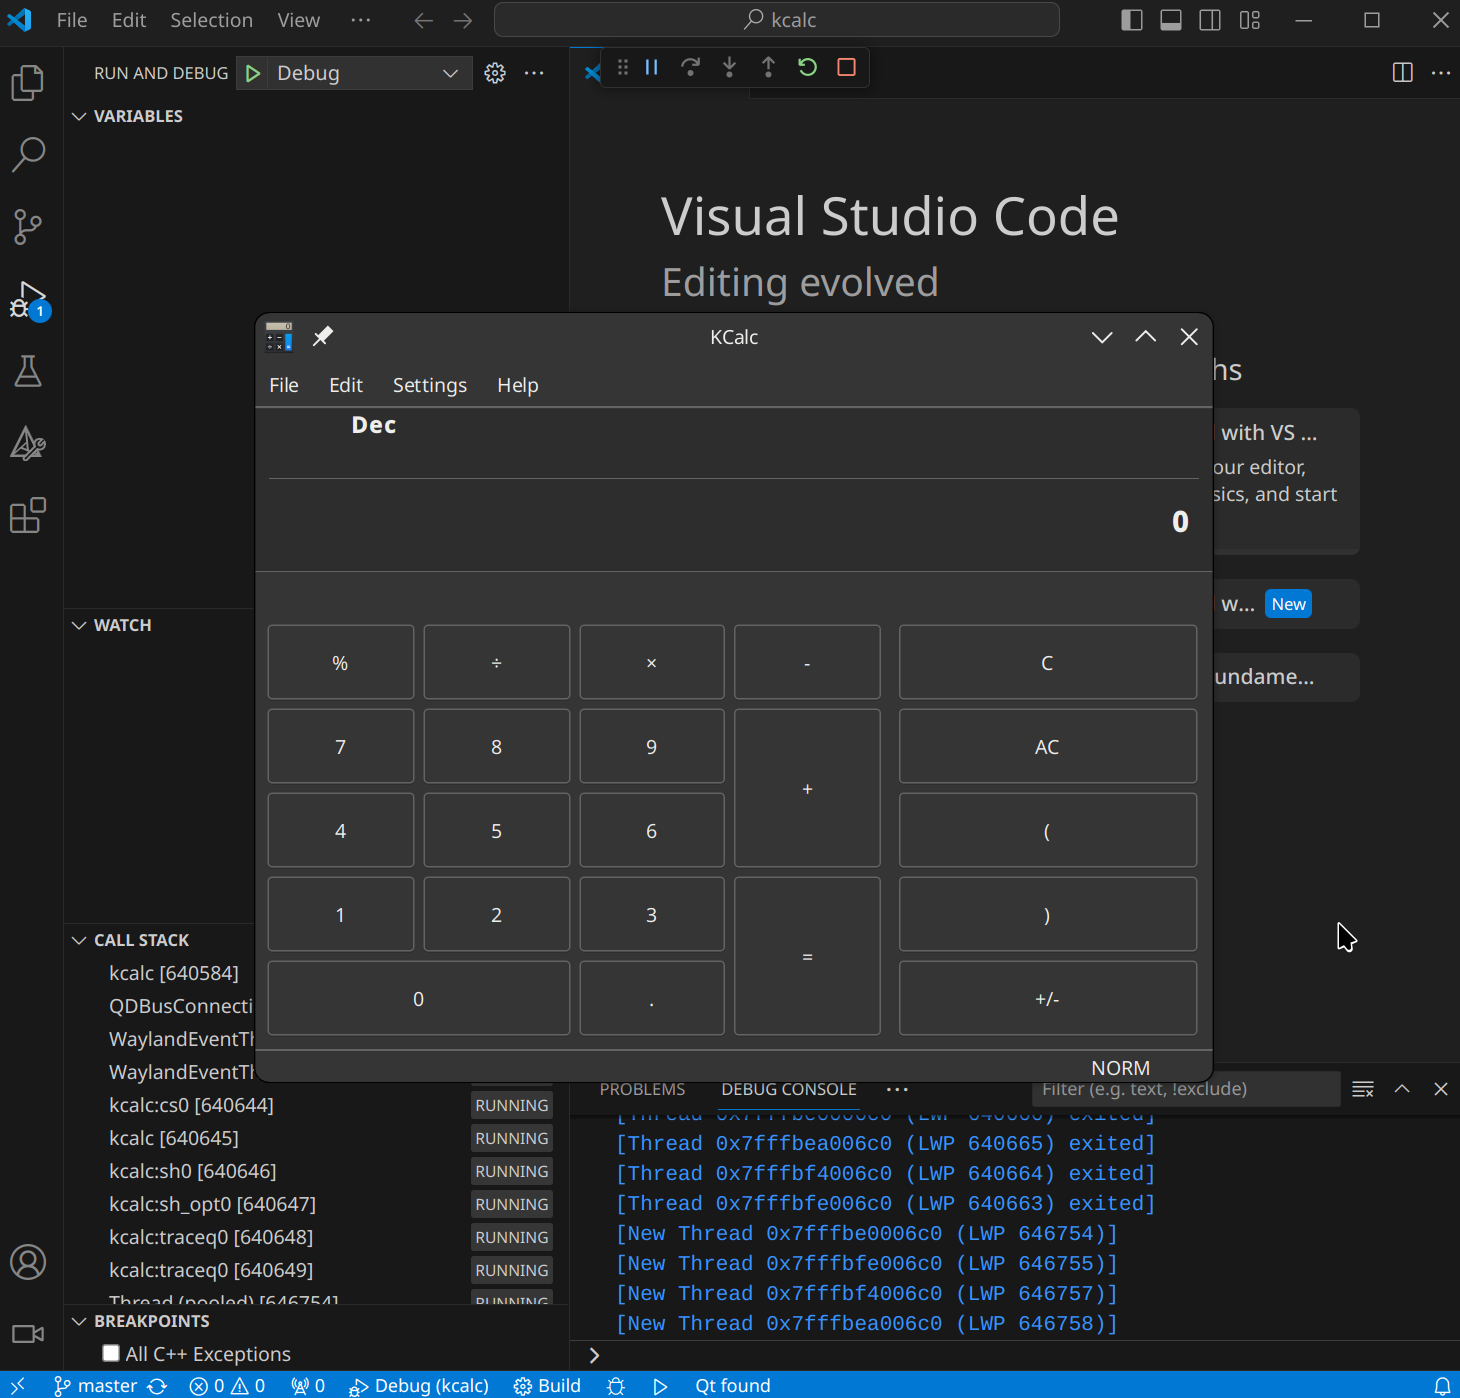
We should now be running a debug session of the kcalc project. 🚀
To later change the target, open the Command Palette (Ctrl+Shift+P) and run
the CMake: Set Debug Target command.
Debugging KCMs
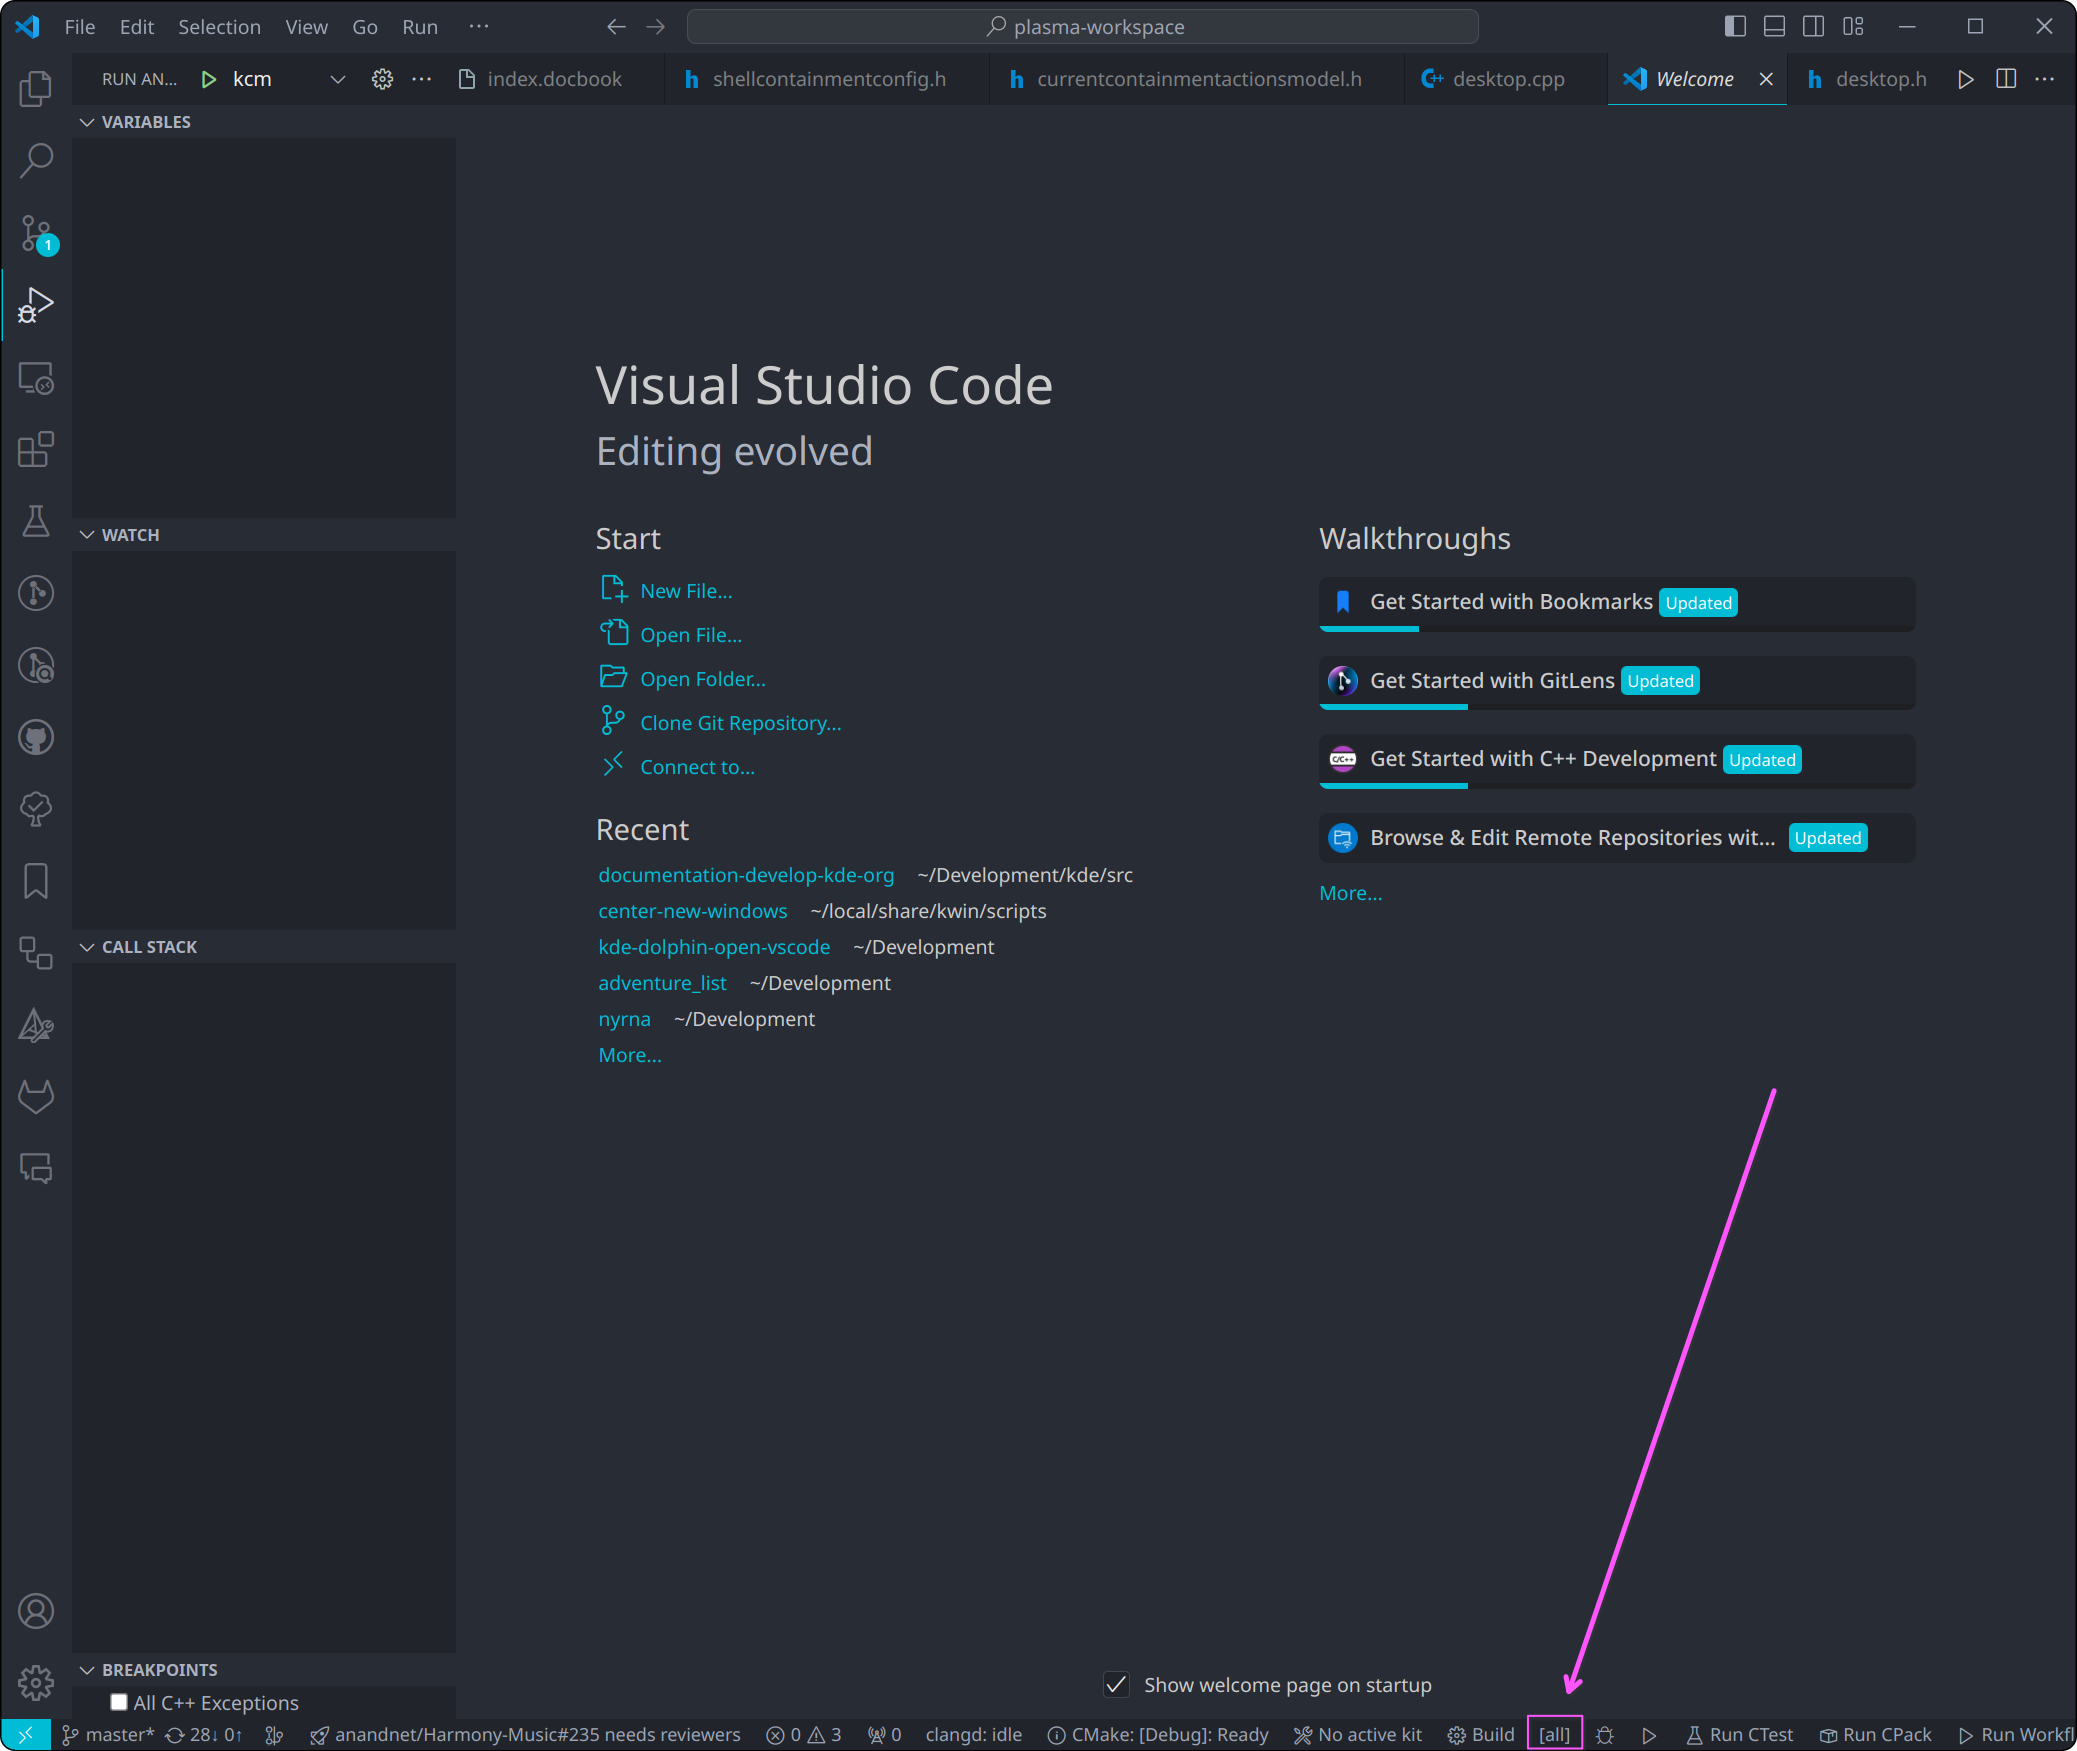
We'll use the plasma-workspace project as an example, as it contains many KDE Configuration Modules (KCMs).
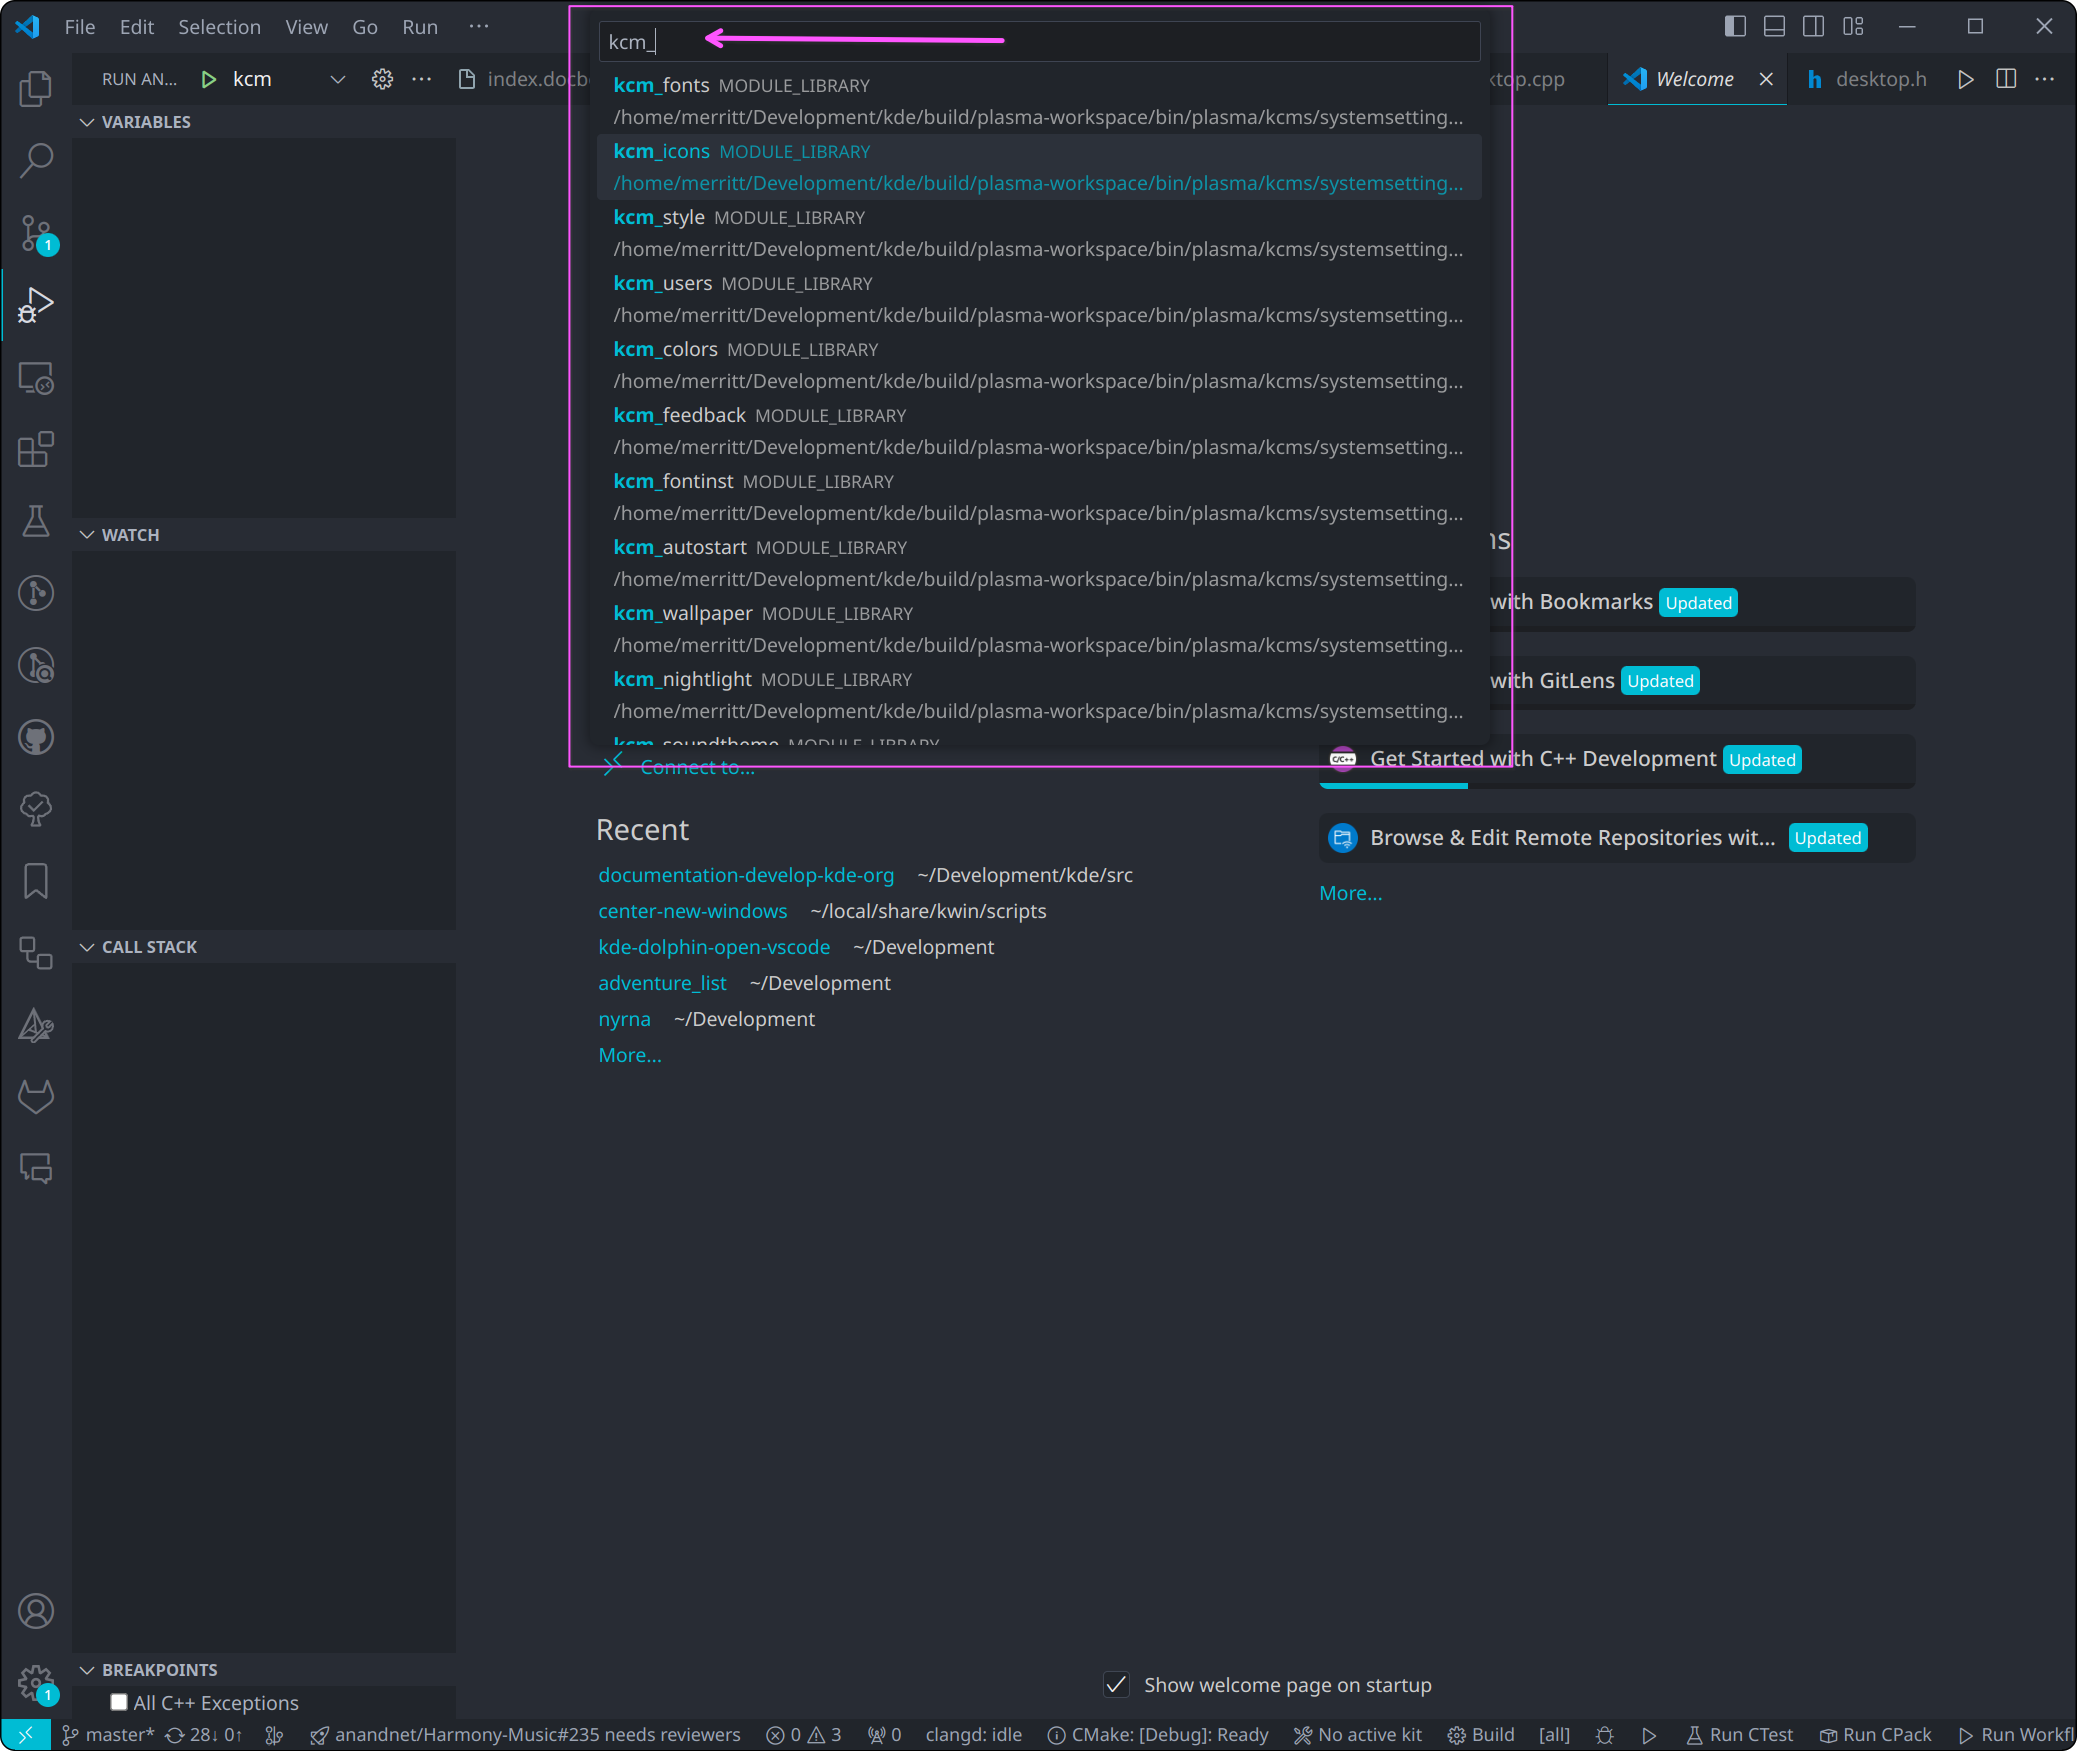
Open the build target selector by clicking the button (defaults to all):
Filter for KCMs by typing kcm_ in the popup, and choose one of the options marked MODULE_LIBRARY that represents a KCM:
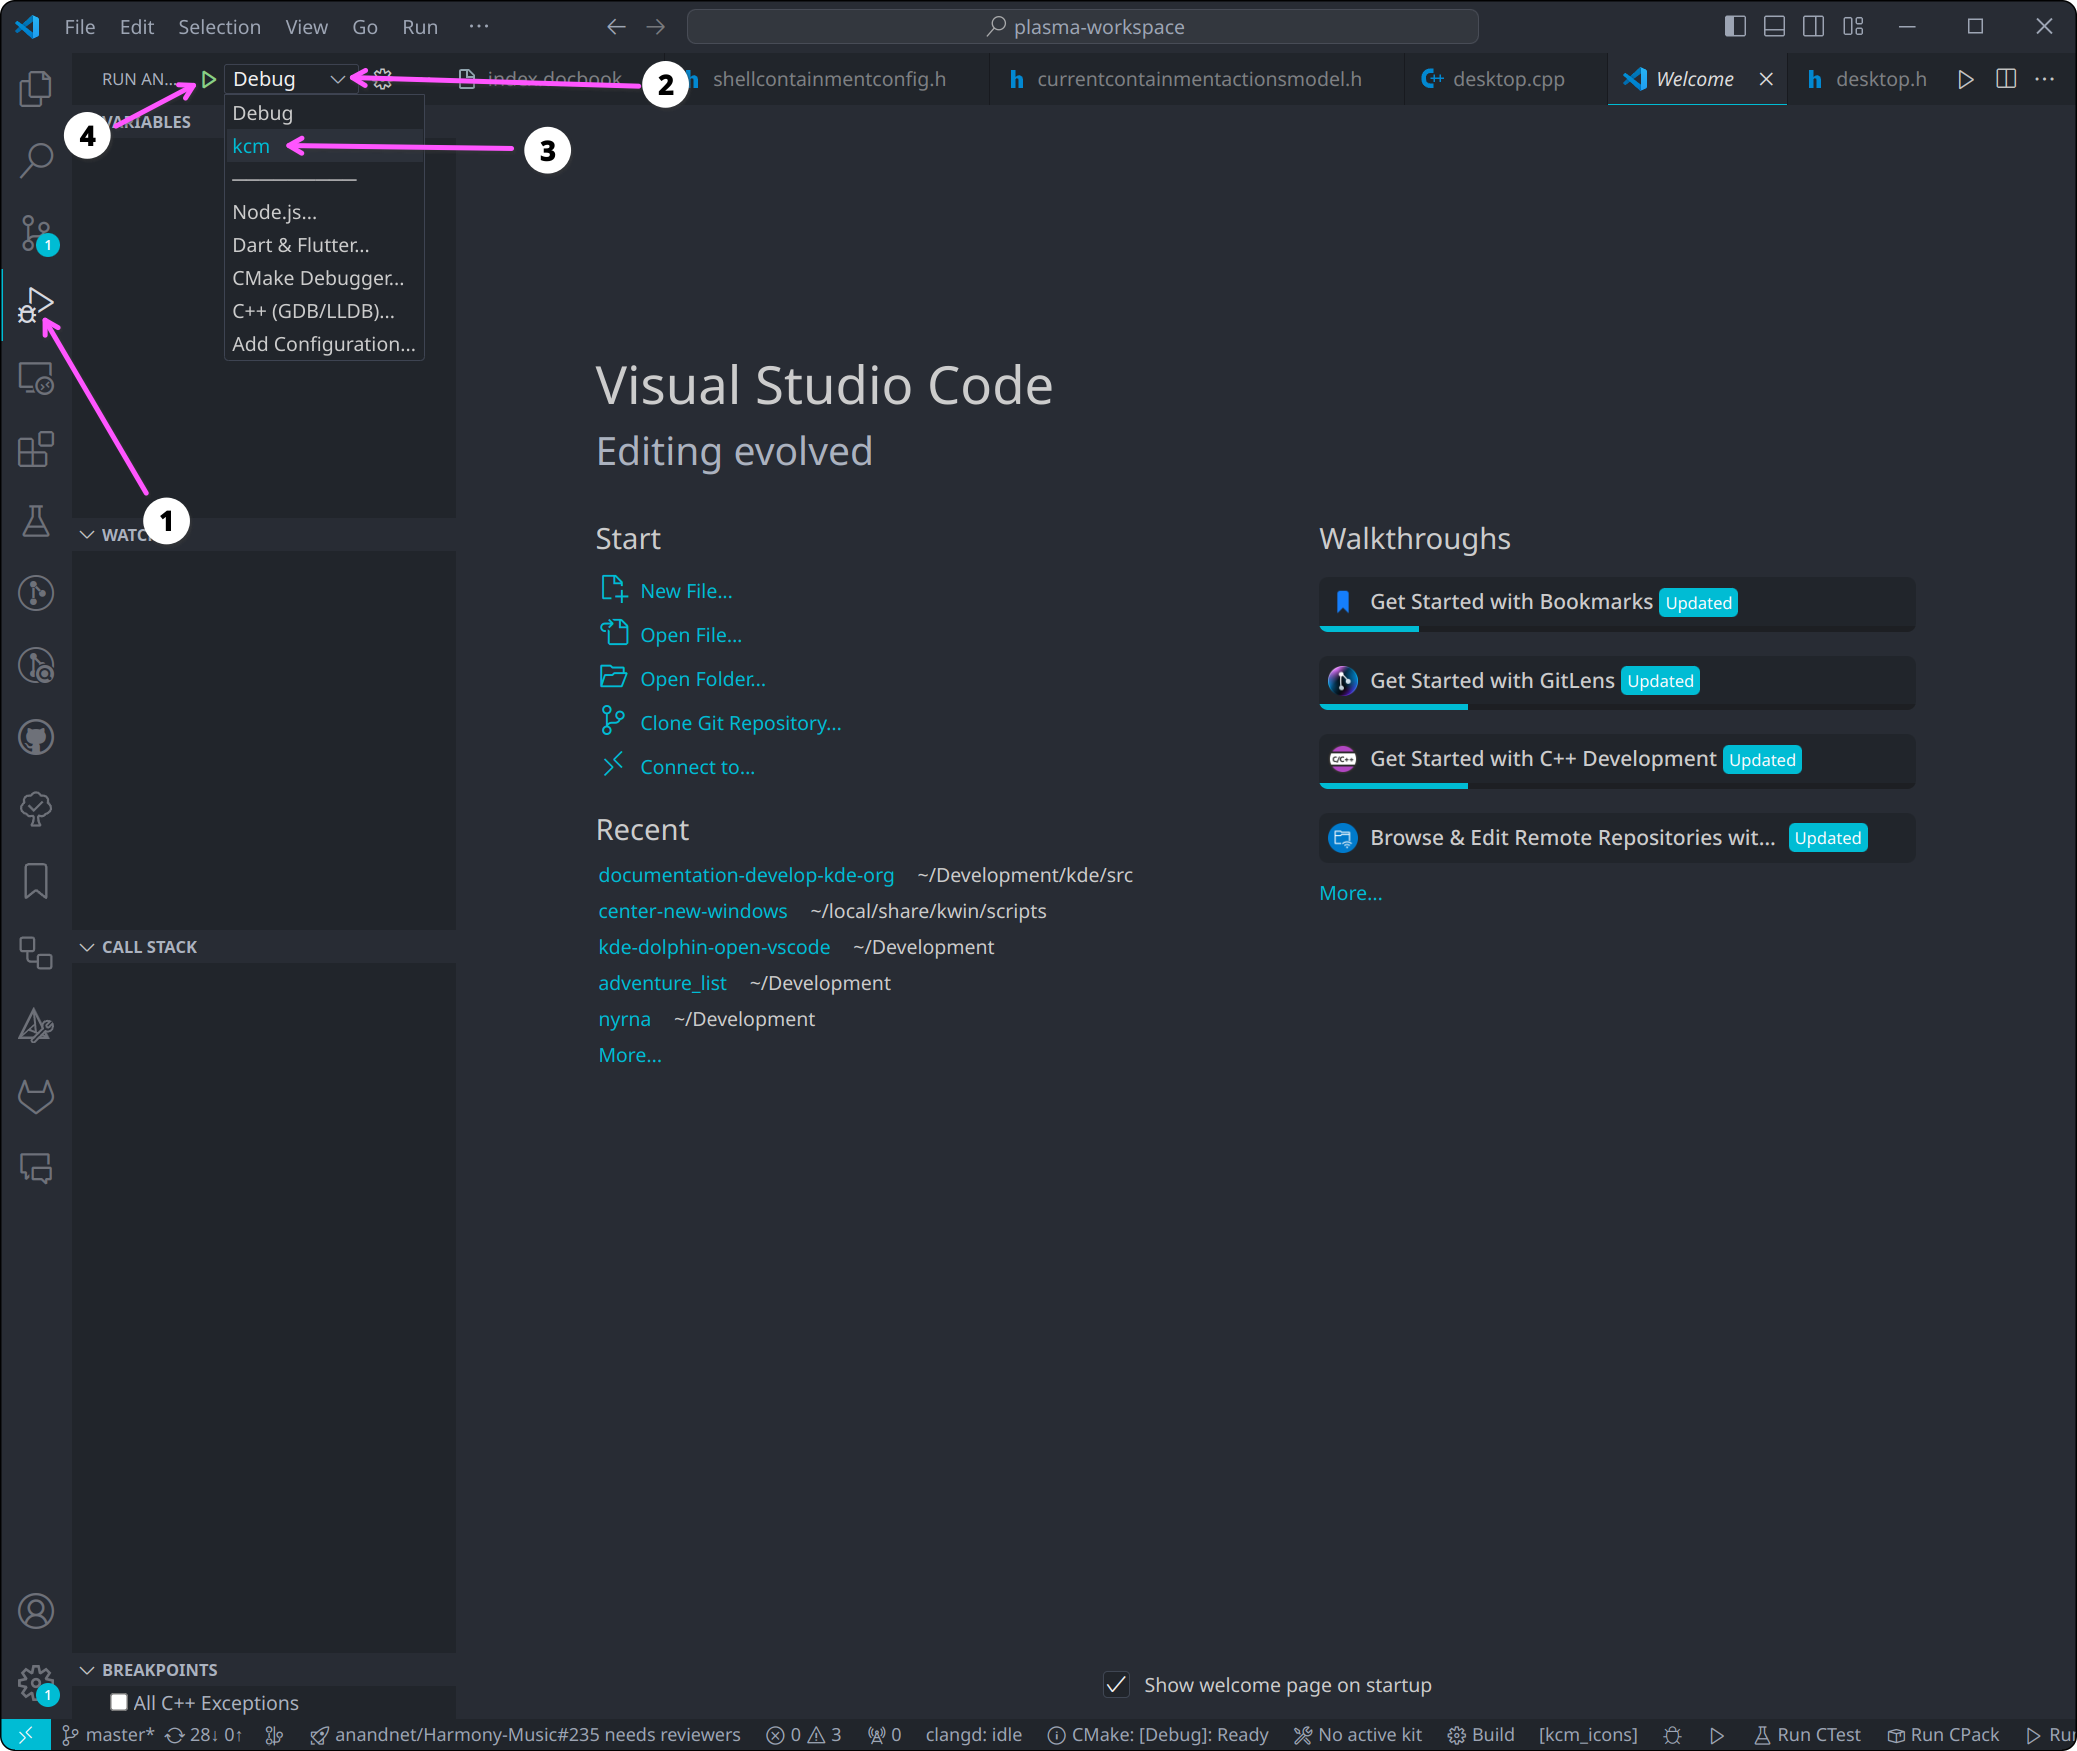
Now you can start debugging the KCM by selecting the kcm launch configuration and clicking the green play button:
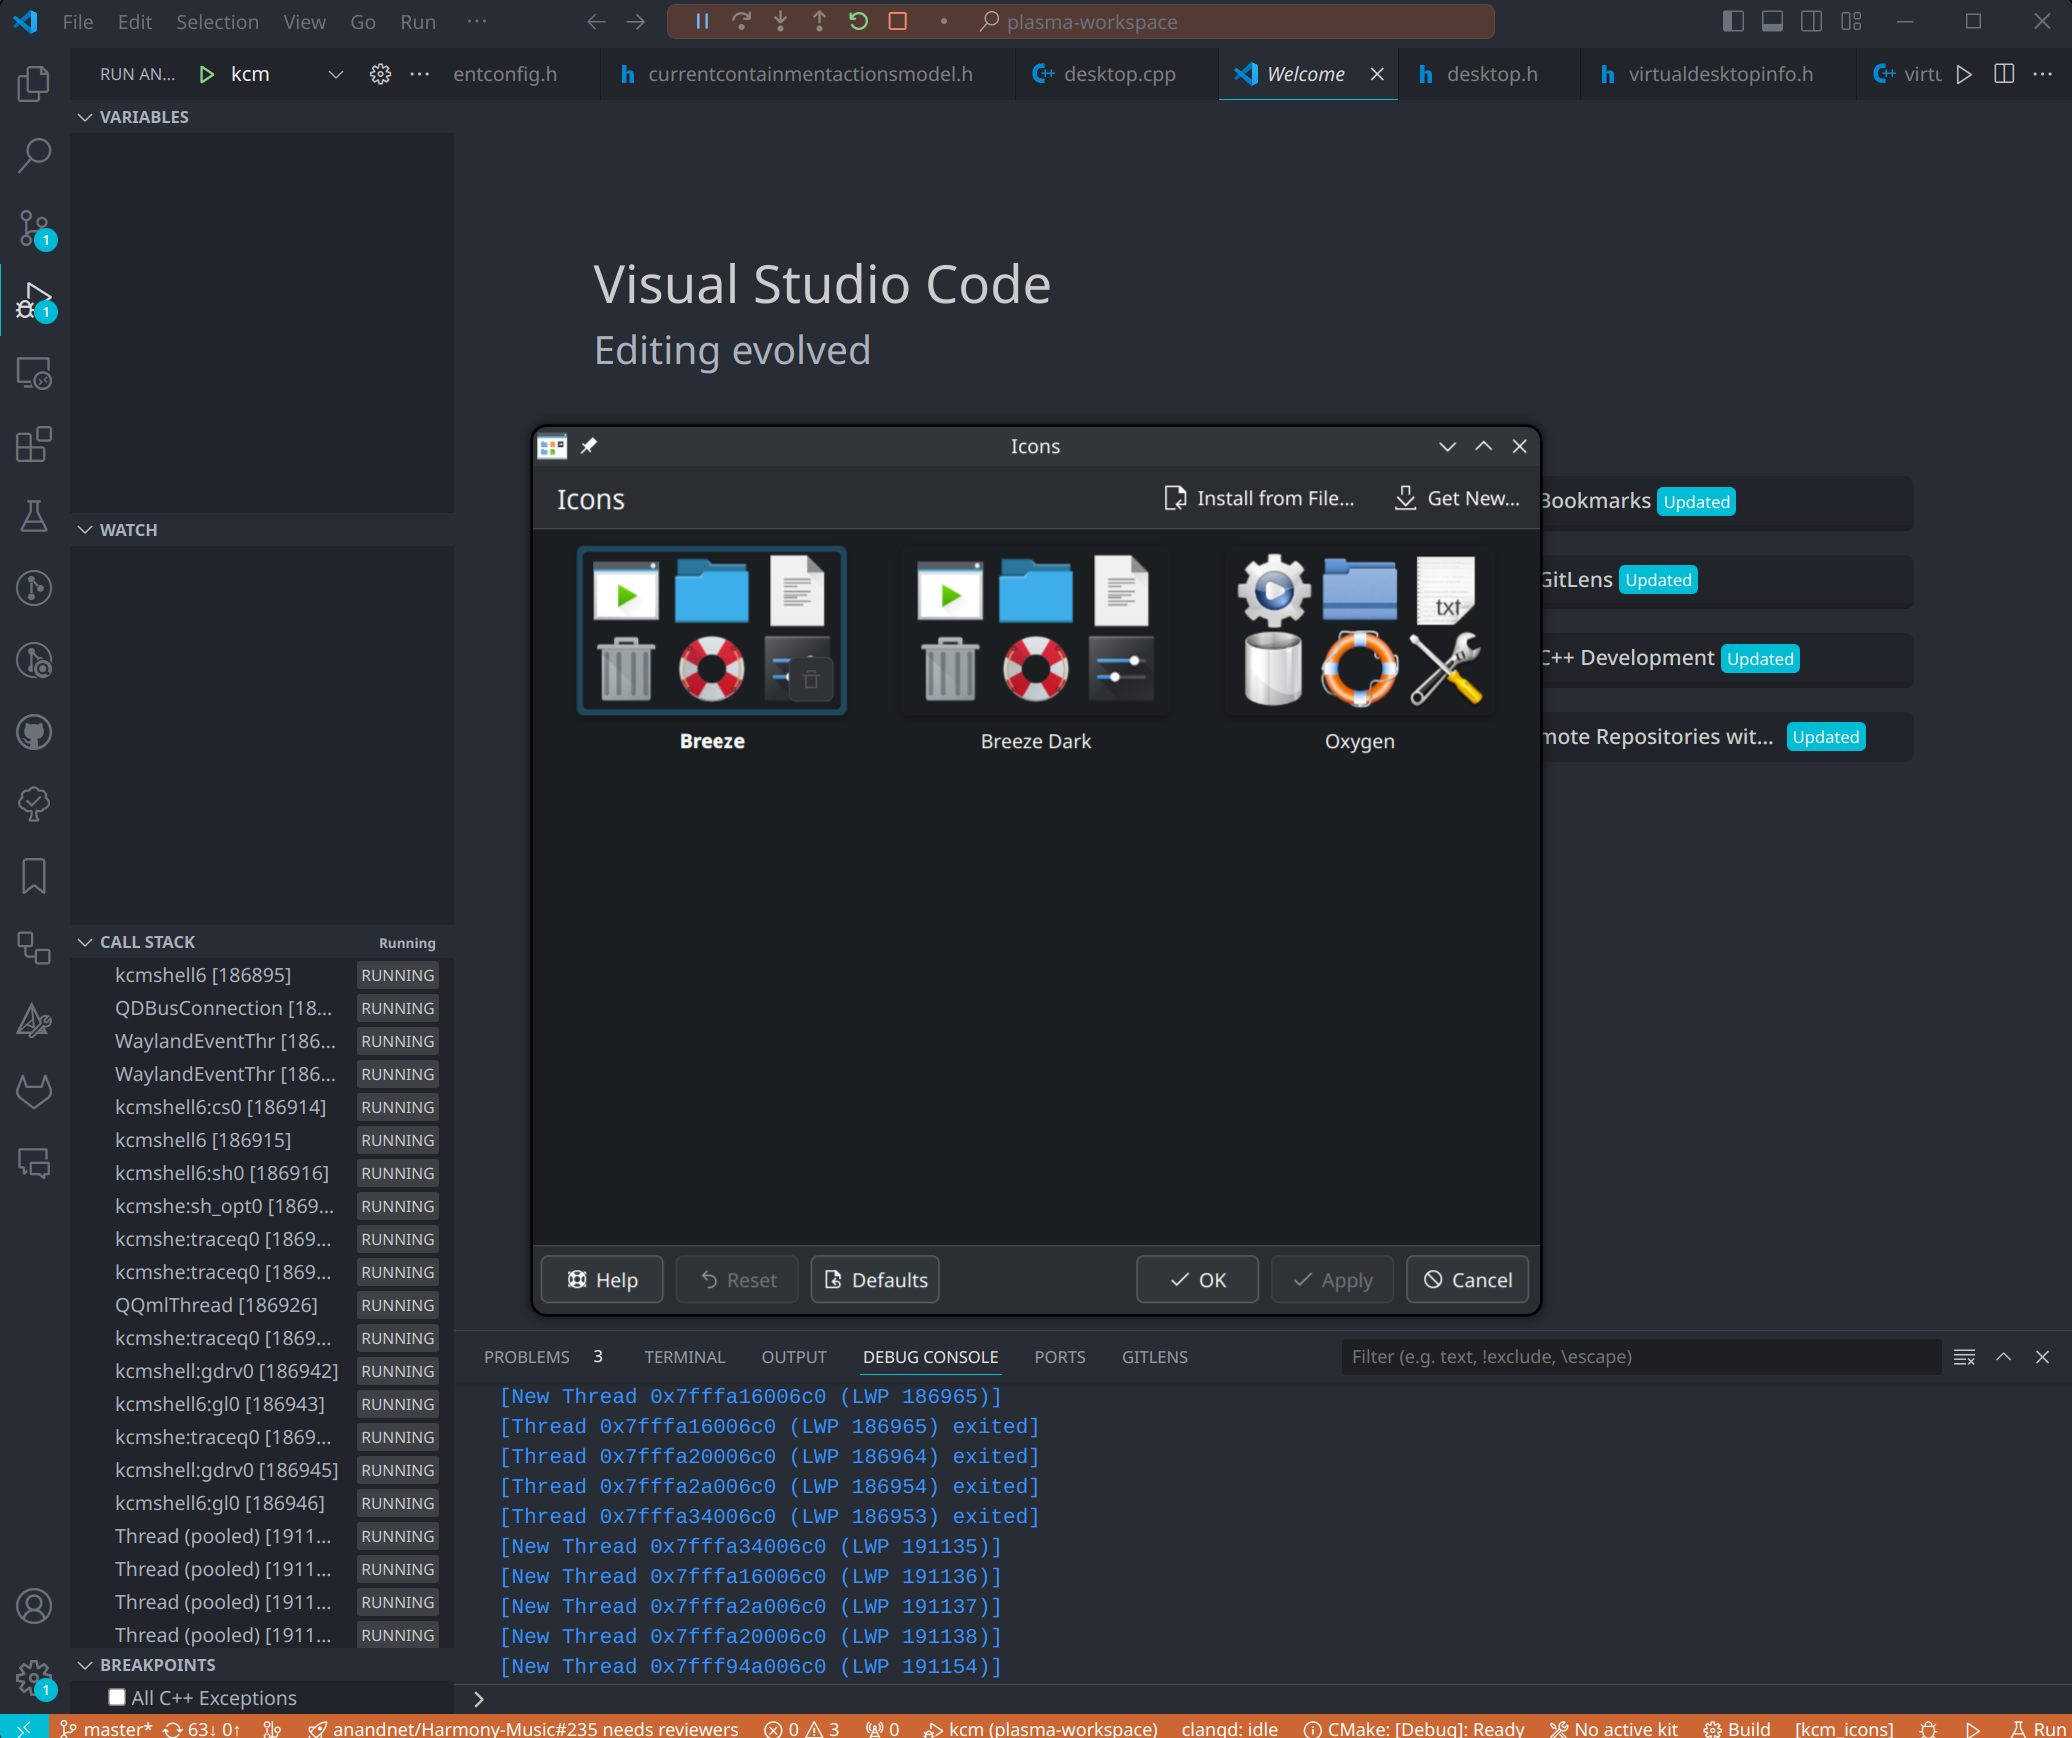
The KCM will open in a new window, and the debugger will hit breakpoints in the C++ code. Breakpoints in QML are sadly not possible.
Debugging with external executables
When developing a library, it may be convenient to launch an application that uses it from the current project. For example, working with Ark's libraries used
in Dolphin context menu actions. You can set your run configuration to launch a custom binary, such as dolphin.
To do that, follow these steps:
- Open your
launch.jsonfile (Run -> Open Configurations). - Copy the existing launch configuration from the
configurationsentry inlaunch.jsonand paste it as a new one. - In the
namefield, use something meaningful; for example "Launch Dolphin" so you will recognize it from the run configuration dialog. - In the
programfield, use the path to the executable to be run. For example,/home/username/kde/usr/bin/dolphin. - Save the
launch.jsonfile.
Example of edited launch.json
         },
+        {
+            "name": "Launch Dolphin",
+            "type": "cppdbg",
+            "request": "launch",
+            "program": "/home/andrew/kde6/usr/bin/dolphin",
+            "args": [],
+            "preLaunchTask": "KDE Builder pre-launch task",
+            "stopAtEntry": false,
+            "cwd": "${workspaceFolder}",
+            "environment": [
+                {
+                    "name": "PATH",
+                    "value": "/home/andrew/kde6/usr/bin:${env:PATH}"
+                },
+                {
+                    "name": "XDG_DATA_DIRS",
+                    "value": "/home/andrew/kde6/usr/share:${XDG_DATA_DIRS:-/usr/local/share:/usr/share}"
+                },
+                {
+                    "name": "XDG_CONFIG_DIRS",
+                    "value": "/home/andrew/kde6/usr/etc/xdg:${env:XDG_CONFIG_DIRS}:/etc/xdg"
+                },
+                {
+                    "name": "QT_PLUGIN_PATH",
+                    "value": "/home/andrew/kde6/usr/lib/plugins:${env:QT_PLUGIN_PATH}"
+                },
+                {
+                    "name": "QML2_IMPORT_PATH",
+                    "value": "/home/andrew/kde6/usr/lib/qml:${env:QML2_IMPORT_PATH}"
+                },
+                {
+                    "name": "QT_QUICK_CONTROLS_STYLE_PATH",
+                    "value": "/home/andrew/kde6/usr/lib/qml/QtQuick/Controls.2/:${env:QT_QUICK_CONTROLS_STYLE_PATH}"
+                },
+                {
+                    "name": "MANPATH",
+                    "value": "/home/andrew/kde6/usr/share/man:${MANPATH:-/usr/local/share/man:/usr/share/man}"
+                },
+                {
+                    "name": "SASL_PATH",
+                    "value": "/home/andrew/kde6/usr/lib/sasl2:$SASL_PATH"
+                }
+            ],
+            "envFile": "/home/andrew/kde6/qt_logging_environment.sh", // cannot be a script, see https://github.com/microsoft/vscode-cpptools/issues/9329 feature request.
+            "externalConsole": false,
+            "MIMode": "gdb",
+            "setupCommands": [
+                {
+                    "description": "Enable pretty-printing for gdb",
+                    "text": "-enable-pretty-printing",
+                    "ignoreFailures": true
+                }
+            ]
+        },
         {
             // Debug a KCM.
             "name": "kcm",
             "type": "cppdbg",
Now open "Run" view from the Activity Bar. Select newly appeared "Launch Dolphin" configuration.
When you debug with this configuration Ark will be built, but Dolphin will be launched, and the IDE can still hit breakpoints in the Ark code.
Troubleshooting
- Reloading the window (Command Palette ->
Developer: Reload Window) can fix some issues, and cause notifications/prompts to reappear if they were missed. - Command Palette ->
CMake: Delete Cache and ReconfigureorCMake: Reset CMake Tools Extension State (For troubleshooting)can be useful if things are not working as expected.
Note
In case something goes wrong in config generation, you can use the ide_project_configs logger
to show debug messages related to config generation. To enable the debug level for it, add
--log-level ide_project_configs=DEBUG to the command.
See documentation for more information.
Tips
- The Command Palette
(
Ctrl+Shift+P) is your friend. It allows you to search for and run commands, and is a great way to discover features. - There is extensive documentation available for VS Code at https://code.visualstudio.com/docs.
- There are first-party video tutorials available at https://code.visualstudio.com/docs/getstarted/introvideos.
Notes
The templates for the .vscode configuration files are available
here if you
need to reference them or create them manually.